index
index index
RV Maintenance
Thermal Efficiency 3


RULERMAR.GIF, 1 kB While I was out at Black Butte Lake, I decided to see what the insulation characteristics were on the trailer. Before I began, I let the sun come through the windows and warm the RV up to about 85 degrees. Ya, a little warm, I know. But the greater the temperature difference the more accurate. At sundown, the windows were insulated with Reflectix and the trailer was allowed to cool. I waited a while, to let everything settle, and started the run at 17:00. During this measurement, no furnace heat. And the Hot Water Heater was off. And the refrigerator was turned off.

However, I forgot about the stupid pilot light, which later turned out to be a big issue. But because of that mistake, I was able to write equations that explained internal heat sources. So, it actually turned out to be a really super "good" thing. Now, I would not trade that mistake for anything.

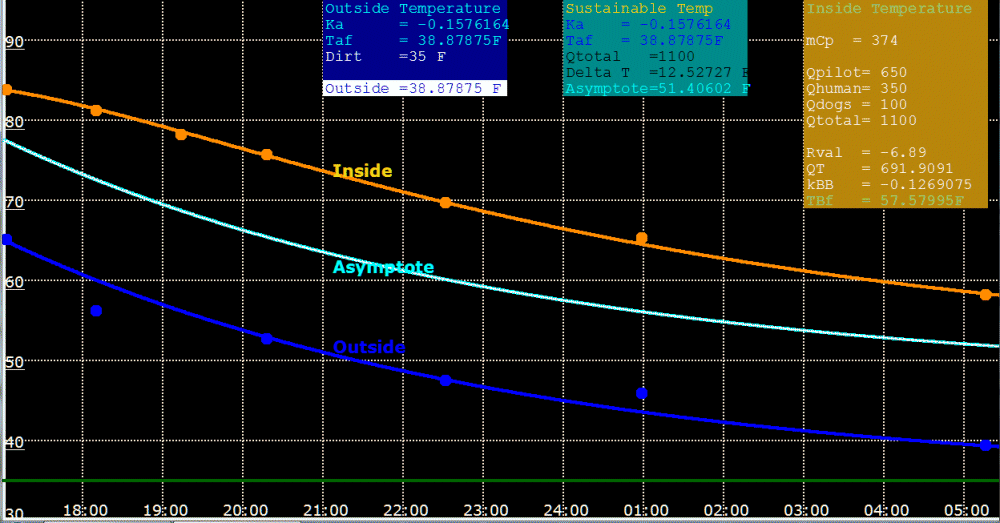
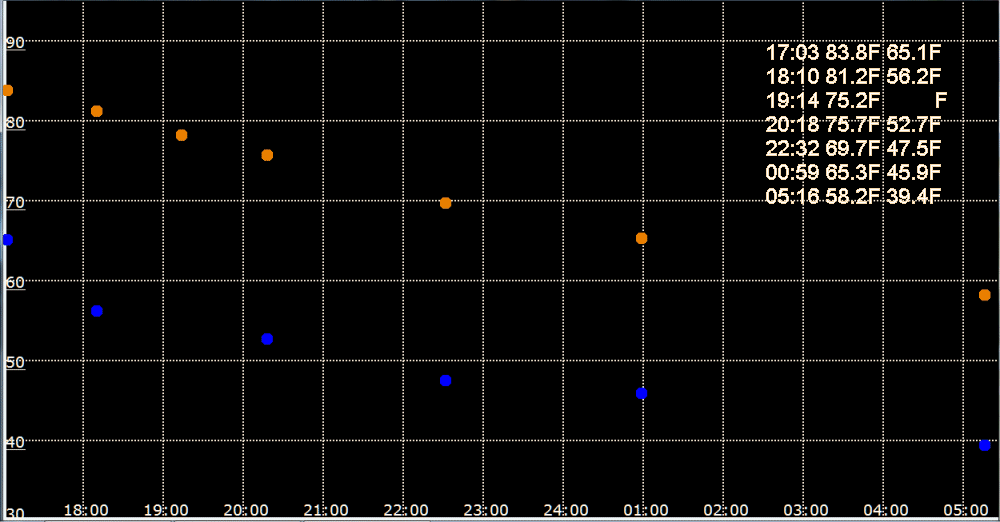
The inside temperature started out much higher than the ambient outside temperature at 83.8 degrees. And I started taking readings at 17:03 with a GPS clock, accurate withen 1 second.

Yellow data points are Inside Temperatures.
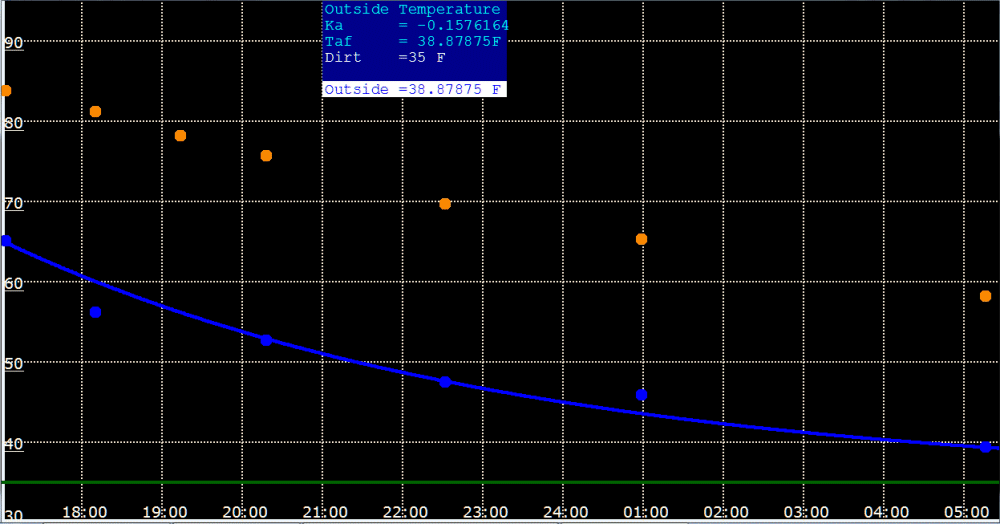
Blue data points are Outside Temperatures.

B-Dots.gif, 28kB
Data:
time inside outside
17:03 83.8F 65.1F
18:10 81.2F 56.2F
19:14 75.2F
20:18 75.7F 52.7F
22:32 69.7F 47.5F
00:59 65.3F 45.9F
05:16 58.2F 39.4F

It is interesting to note a slight rise in slope of temperature at 01:00 that is reflected in both curves.

Also, the two Woofers had to go pee in the middle of the night. In fact, I had to open the door twice for them, and this let in plenty of cold air.

Also, the pilot light was lit in the stove.


Eq-B-TempBlu.gif, 31kB
BBALLBLU.GIF, 139B Graphing of the Blue curve; Outside Temperature.

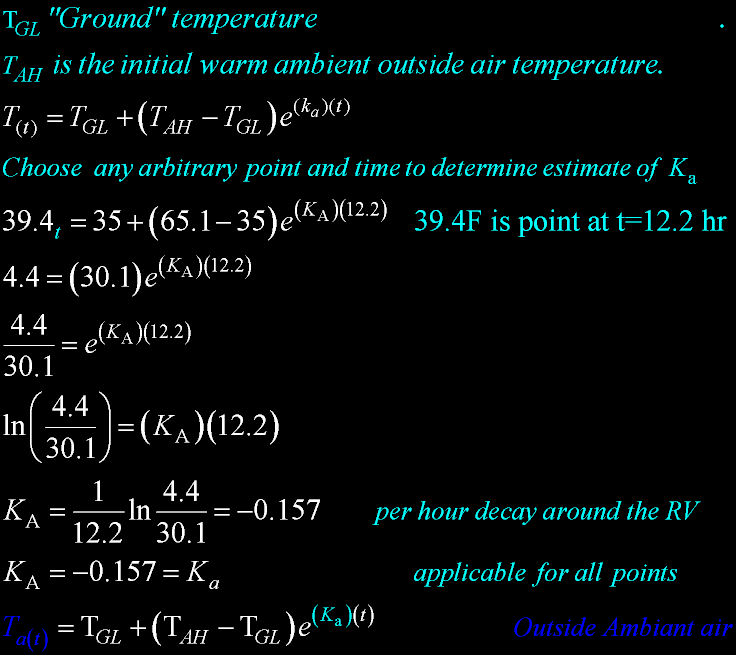
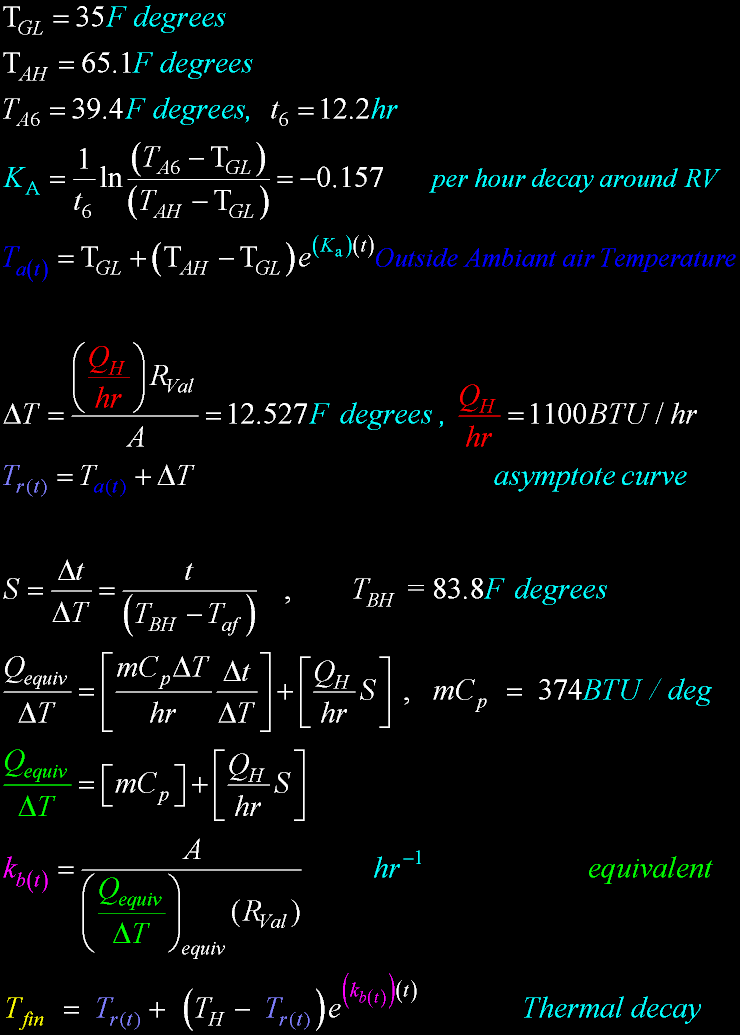
Choose an arbitrary point: at 05:16 39.4F degrees for an initial condition point for the curve. For the curve to pass through this point, Ka must be equal to -0.157.
The starting temperature a 17:03 is 65.1F degrees: TAH. The "ground" temperature TGL is estimated at 35F degrees.


B-BlueCurve.gif, 43kB
BBALLBLU.GIF, 139B Graphing of the Blue curve; Outside Temperature.
One must remember that the outside temperature is a conglomeration of different cooling effects: There is the lake water near by. The black pavement is retaining heat different than the dirt. There is the air and humidity. And there are woody things like trees. And then there is the wind! Breezes are chaotic, and that is a HUGE variable. All these things are impossible to calculate. All of these things, except the breezes, are of the this same logarithmic form. Hopefully, the composit will still be a logarithmic of this decay form. And I am counting on this for my calculations!

The Curve seems to fit of this logarithmic form.


eq-B-OutTempBlu.gif, 4.3kB
As you can see the dirt, water, and trees all contributed logarithmetically, just as I had hoped on this still night. The Blue curve is the Outside temperature, the Ambient temperature. And we must have this equation before we can go on to solve the RV inside temperature. To get this temperature, I had to guess at an Attractor Temperature. That temperature is from the reserve heat in the ground, air, trees, and water. For several nights the temperature at Black Butte has been near freezing. I assumed it was a constant. And it turns out that it is at 35 degrees. I painted this line dark green. I suspect it will be late spring before it starts to slowly come up.


eq-B-Asymptote.gif, 15kB
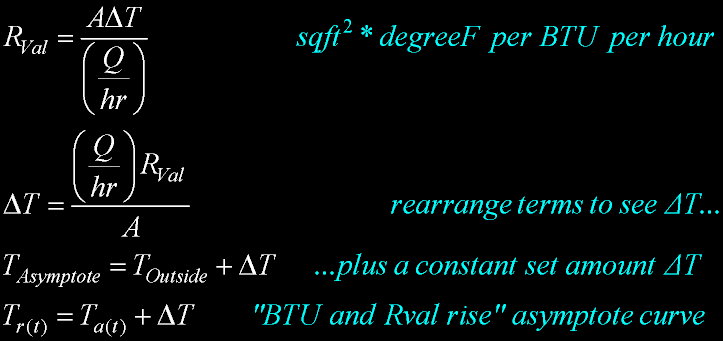
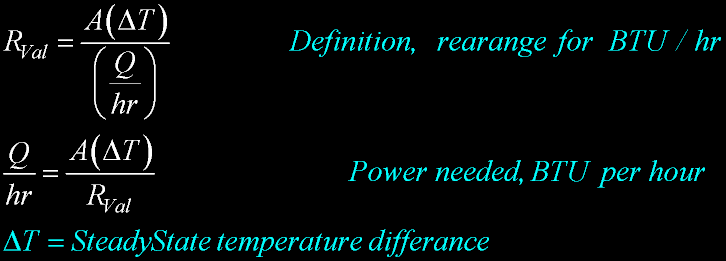
Using the basic definition of Rval, You can rearrange to find delta Temp. Given a certain Rval and surface Area, the Inside of the RV will be this delta Temperature above the outside temperature (given enough time). This is due to the internal heat sources. They are continually generating heat.


eq-B-Qtotal.gif, 6.1kB
The pilot light on the stove is the big one. The main source must be the pilot light. When I open the oven door, the oven measures 125F degrees inside. The top of the stove is slightly warm. My pilot light is about 700 BTU/hour


The Asymptote Line
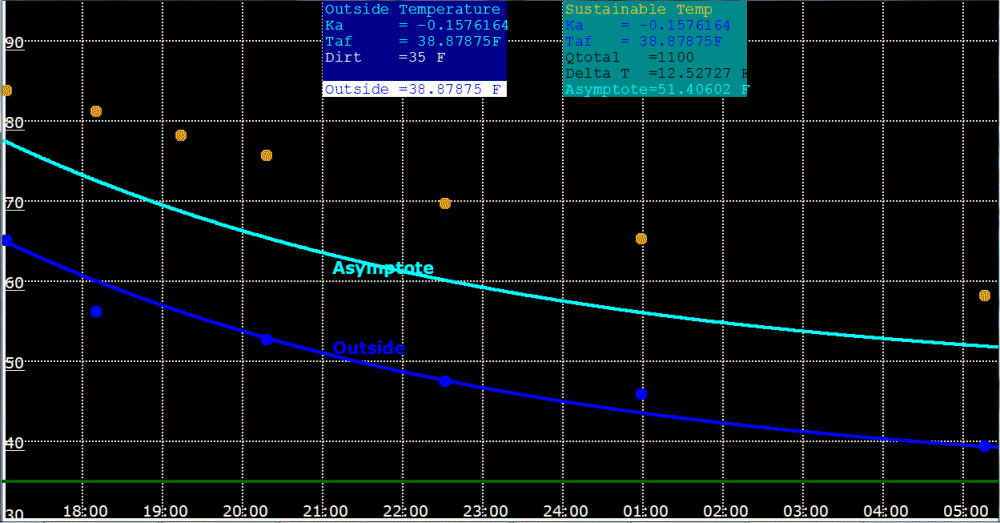
It is in "Cyan" color, and constantly about 12.5 degrees above the Outside Temperature. If the outside temperature levels-off and remains stable without change, heat sources in the RV will always sustain a stable temperature inside the RV that is ABOVE the outside temperature. It is a set amount. In this case it is 12.5 degrees. It is the delta Temp determined by the Qp, Area, Rval. The inside temperature will "approach" this asymptote line, but will never reach it. Well, actually, it could reach it if the Outside temperature slope suddenly turned positive. But if the outside temperature slope continues to decline, as it behaves here, or if it is even zero (level), the inside temperature will never reach it.


B-Asymptote.gif, 53kB
Asymptote curve.
I call it the Asymptote line, but what I mean is that other lines will be asymptotic to this curve.
eq-B-AsymptoteTr.gif, 4.1kB


It should be possible to write the equation with the pilot light, and other stuff, included.

The added energy is continuing to add energy every hour. It is a function of t.
Eq-B-NewTerm.gif, 58kB
I wrote this new equation.

To write this, I took liberties, and I had to make assumptions. But I have a creative license, and the computer stayed with me, and wrote equations that give a very accurate graph.


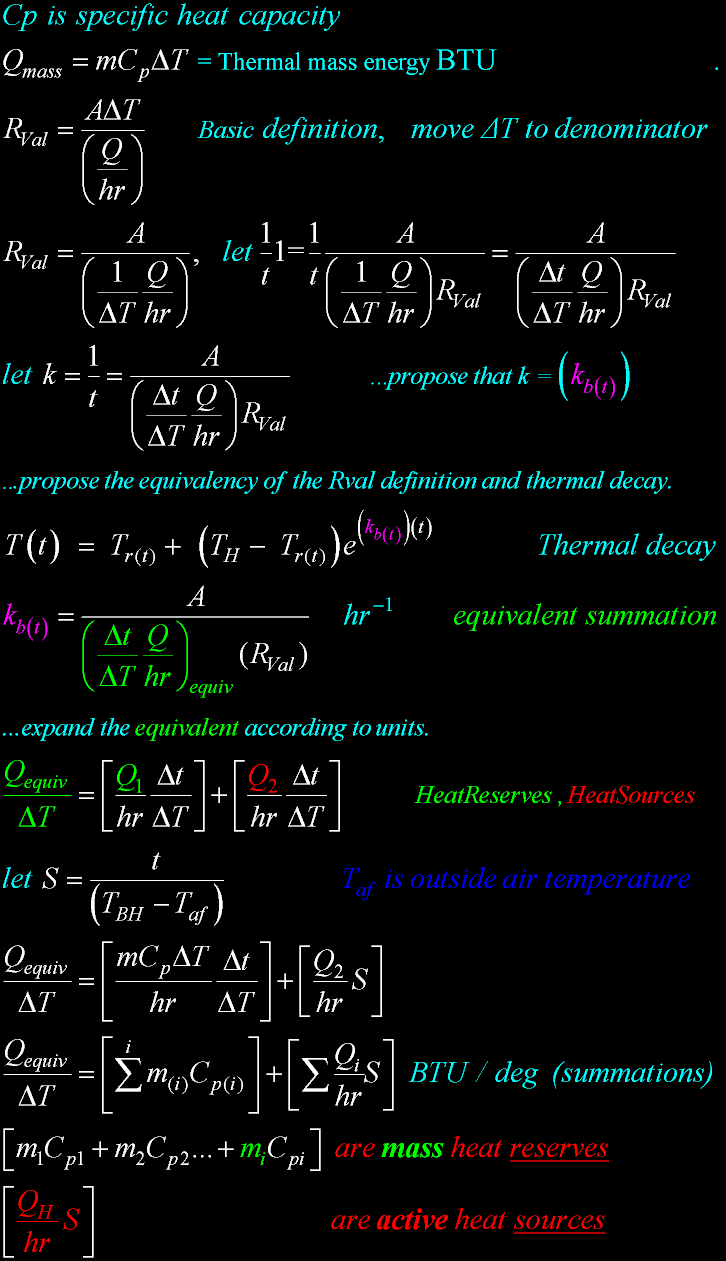
I began by taking the basic definition of the Rval. And trying to relate it to the "Decay Function". That decay function has an exponent, k. And there MUST be a correlation between how a thing cools down in the Decay Function and its Rval. There is NOTHING else to control its behavior. I multiply both sides of the equation by 1/t. These are the same units as k, so I will assume that it is possible that k could equal this. Later, it will be clear that it is indeed true.

Once that is established in what I call an Equivalent, then I turn my attention to creating an Active Heat term, to explain the pilot light.

And then two terms materialize, including my Active Heat term. Th Heat Source term is colored "red". I invented this term, a function of t, to continually supply new heat, and raise the curve.


eq-B-FirstTerm.gif, 7.2kB
All mass throughout the inside of the RV has heat and thermal inertia. All the inside mass of all types of specific heats are lumped together, and given an average Cp. This includes such things as canned goods and bottled water, and the wood of the walls.

But I have a problem with my fresh water tank, a 60 gallon tank, which has a dual purpose. It is also used as a heat reservoir.
My RV, unlike other RVs, was designed with the Fresh Water Tank as not only supplying warm water, but also as a heat reservoir. The reservoir holds a BTU per degree per pound. The warm water, just under the floor, would supply more thermal inertia, and more heat reserves.

At the time, it was 35 gallons full.
It is basic to see:
8.34 lb/gallon, 1BTU/degree/lb, = 291.9 BTU/degree

But then again, the water does not have easy access to the inside, as it is just beneath the floor. The tank is insulated from below to the outside, which is great. But also, unfortunately, insulated somewhat from the inside area. Probably, the tank does not need to be analysed in isolation. Certainly, it will be added in automatically, so forget that I mentioned it.


eq-B-SecondTerm.gif, 7.5kB
This is the only term that can "raise" the graph. The other term are decaying. This term is active, and continually supplying energy and BTU Heat.
It is NOT part of a "closed" system. An example would be an active heat source such as the stove pilot light, which is supplying aprox 650 BTU/hr. As for the BTUs of the pilot...
That is not known exactly. The spec is 700 BTU/hr. But my pilot light gasses are vented to the outside. This was a modification that I made to the stove. Thus, the heat into the RV can not be 100% efficient. So the value should be somewhere less than 700.
In addition there is body heat. I estimated 300 BTUs/hr for me, and about 100 for the doggies. Just guesses.
The units for this term are Q per temperature, the same as the other term.


Eq-B-kbt.gif, 3.9kB

eq-B-Fin.gif, 4.6kB

B-GoldCurve.gif, 72kB

Eq-B-NewTerm-ie.gif, 35kB
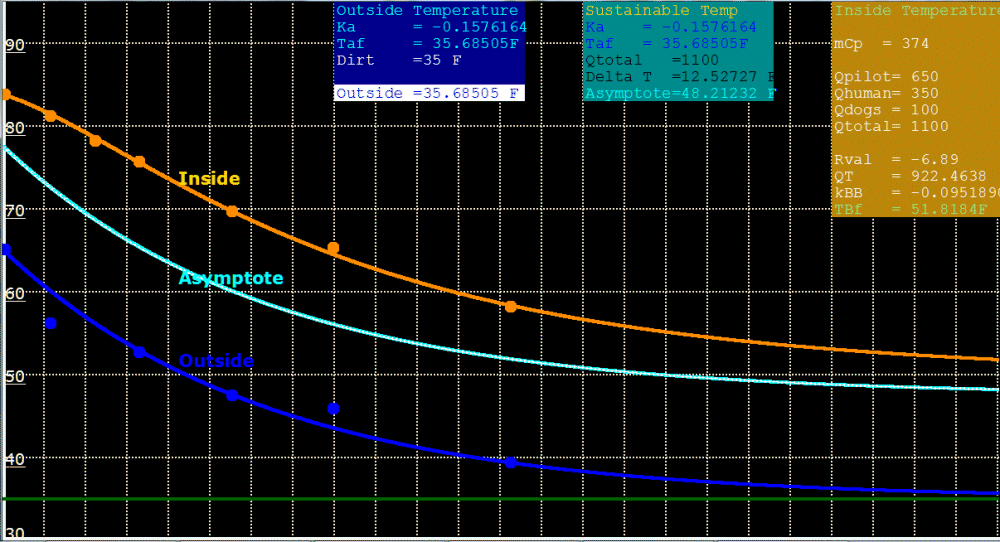
BBALLYEL.GIF, 154B The final curve. The main curve.
The other two curves, the Blue and Cyan, support this gold curve.
Here are the specific values that made this beautiful gold plot.

I should talk about S...
At first, I invented S as an inverse "slope", a true deferential. But it did not work. Then I realized that it was a "delta". The denominator as the difference between the start inside Temperature and the outside Temperature. And the numerator as the difference between the Start time of zero, and the active time. Actually, reverse that order: S is positive.

I put those values in the equations and the curve lined up with the data points. I was surprised! I retained the misleading name of "S", although it has nothing to do with "slope".
BBALLGRN.GIF, 138B Internal Stores, mass energy reserves:
mCp=374 BTU/deg
The old value was 144 BTU/deg, which I think was too low and not enough "stuff". I like the new value better...
mCp is the Specific Heat, Cp, times mass (m). Things in the RV "hold" heat. These include cans of food in the cupboards, the commode and tub, the steel of the stove, and the wood of the walls. This is an average of all the masses all over inside of the RV. mCp is Q per degree. So the real essence of mCp is Q (in BTU) per degree.
The units of mCp are Q/(delta Temperature), or BTU per degree.

BBALLWHT.GIF, 936B Rval:
The Old Rval value was Rval=-6.447.
Then it was -6.7
New value is -6.89,
Rval=-6.89
There has been no great improvement due to the insulation itself.
The new Rval is very much a guess. The Rval can only be determined accurately by "the definition" method. And that was not done this time. To measure Rval directly, the furnace needs to produce a lot of BTUs, and the furnace needs to come on and off to maintain a constant temperature.


Eq-B-kbt-Equiv.gif, 3.9kB
the Main Exponent
BBALLPUR.GIF, 880B Here is the "main" exponent: kb(t)
The units of K are 1/t.
And kt taken together are diminsionless. k, by itself, is like a percentage loss per time.
I have always been suspicious, and wanted a way to express, a relationship of R-Value to the natural decay function.
So, I created two terms withen my "equivalent".

Old time constants were about -0.16/t, and represent a fast decay and a lot of losses.
The NEW Decay Time Constant k = -0.1269, 12.69% decline/hr, is a wonderful difference. And!...
I think I have a way to derive the Rval from the Decay function, and visa versa.
If the reciprocal of k = 1/Rval
Then
Rval=7.88, an insulation constant commonly used in home building.

of course, it is inflated due to pilot light and body heat that I have been discousing. But certanly the best so far. The better k value, and the better Rval, is due to my RV work of running around stuffing insulation, and from my work on the stove.

I might do one more calculation. One without the blue and cyan lines. The Blue outside temperature curve is not liniar. But!... If it could be treated as liniar, and a constant straight line, then the outside temperature could be taken as an Average.
From 65.1 to 39.4, average is 52.3 degrees Outside.
t=12.2 hr
FinResult=Av+(MaxStart-Av)e^-kt

58.2 = 52.3+(83.8-52.3)e^-kt
5.9=31.5 e^k(12.2)
0.187= e^-k(12.2)
ln(0.187)=-12.2k
k=-0.137, 13.7% decline every hour
Rval=7.27
As an estament: 7.27 to Rval to 7.88

(Just as a note, I need to compare the Vans Insulation:
Rval=4.642
mCp=685.7
The mCp is over twice that of the RV! So much more steel and thermal inertia in the Van, especially from the engine and tranny and steel floor. Dispite it's poor insulation, it is slow to change temperature.)


BBALLRED.GIF, 156B Q total is 1100 BTU/hr.
Certainly, 1100 was an educated guess, but it tracks well on the graph. The human body produces about half of the pilot light energy. About 300 BTU/hr or 100W.

I did work on the stove. The pilot light gasses are vented to the outside: thus, the pilot light can not be 100% efficient. It has to be less than the 700 BTU/hr. I never imagined that such heat sources would be significant and actually show up in the calculations. But they do! Although all these things started out as mere guesses, - there they ARE!
As plain as day!

The value is responsible for the asymptote curve, at 12.5 degrees above the outside temperature, as well as raising the final curve.

BBALLWHT.GIF, 936B A is 605 sq ft, surface area. A is the surface area of the RV: the four walls, ceiling and floor.


The Outside temperature Line
eq-B-OutTempBlu.gif, 4.3kB
BBALLBLU.GIF, 139B Outside Temperature Taf must be expressable as a function of t. Notice the Outside Temperature at 01:00 in the morning. The wild temperatures at night are not exactly expressable by a simple formula. So the corresponding Inside Temperature point at 01:00 is forgiven for being slightly high, because it was required that all points behave predictably, and the outside temperature be expressable as a formula. The one caveat to my equations is that the outside temperature must be expressable as some kind of function of t. That is not always so easy to do, as the outside temperature can be such a "wild" thing. Fortunately, on still nights, it seems to be a simple decay logarithmic.


eq-B-AsymptoteTr.gif, 4.1kB
BBALLBLU.GIF, 139B Modify the Outside-Temperature to form the Outside Attractor: Tr(t)
This will go into the final, equation. I conjured this up without any formal proof. As the time goes to infinity, the asymptotic nature of the final equation becomes clear.

Without internal heat, the "normal" asymptote line would simply be the Outside Temperature. But my RV has continuous internal heat generation. The Q heat will create a temperature difference. In this case about 12.5 degrees. An imaginary line will run 12.5 degrees above the outside temperature.


eq-B-FinTr.gif, 4.5kB
the Main Equation
BBALLYEL.GIF, 154B Tfin is the Inside Temperature.
BBALLBLU.GIF, 139B Tr(t) is the Outside Temperature Ta(t), plus the heat rise amount; A changing varible, a function of t.
BBALLWHT.GIF, 936B TBH is the specific (Hottest) Starting Inside Temperature. A constant.
BBALLPUR.GIF, 880B kb(t) is the main exponent. And contains my two Equivalent terms.


RULERMAR.GIF, 1.6kB
eq-B-QBTUs.gif, 11kB
Example (worst case scenario):
83.8 to 82.8 Inside almost steady state
35 outside steady state
24 hours/day
4143BTUs/hr Total - 1220 BTUs/hr body heat = 2913 BTU/hr = 853.7 Watts

2913 BTU/hr:
650000BTU/Canister, = 223 hrs = 9.3 days, 9.3days/$25, = $80/month

853 Watts:
0.853 kW * $0.15= 12.8 cents/hr =$3.07/day = $92/month

RULERMAR.GIF, 1.6kB
eq-B-QBTUs1.gif, 4.5kB
Example (probable):
72 Inside
50 outside
659 BTU/hr during only 12 hours, at night. 659 BTU/hr = 193 Watts
659 BTU/hr * 12hr/day = 7908 BTUs/day , 650000/7908 = 82.2 days, =$9/month
193Watts, 0.193*.15= , $10/month


Utility Electricity is more expensive than my onboard Propane.
But at most full hookups, electricity is free, and it's use is a no-brainer.

Until the insulation characteristics change in my RV, I can now calculate the inside temperature; using changing outside temperatures, and different inside heat sources. ...And I can also see the insulation improvements. RULERMAR.GIF, 1.6kB


B-exteded.gif, 83kB Extended graph


Extended graph

BandonBeach.jpg, 19kB Now clearly, with the graphing, my trailer is fixed and it is working great as it should, at least on paper. Can't stand to have a broken trailer due to a faulty cooling curve. With the equations done, I have the perfect excuse to test out the equations and the RV at the ocean or a lake. It is just the right amount of excuse. Not too much. Time to go. Gotta get gas and get it hitched up first though, then decide where...

I do not like reservations and restrictions. But unfortunately, reservations are becoming more necessary each year.

Linda says that I have Aspergers with all these graphs and such. Probably do. No matter; I notice that she is still eager to hop in and go.
RULERBOW